I wanted to pause the game before the end of Month 12 to look at the 12 month report graphs and find problems in my industries. However, I’m forced to do so at the middle of month 11 instead, because as soon as month 12 hits, all the graphs (and numbers?) of the report bug out. The game might be thinking that month 12 = the next year?
Some examples:
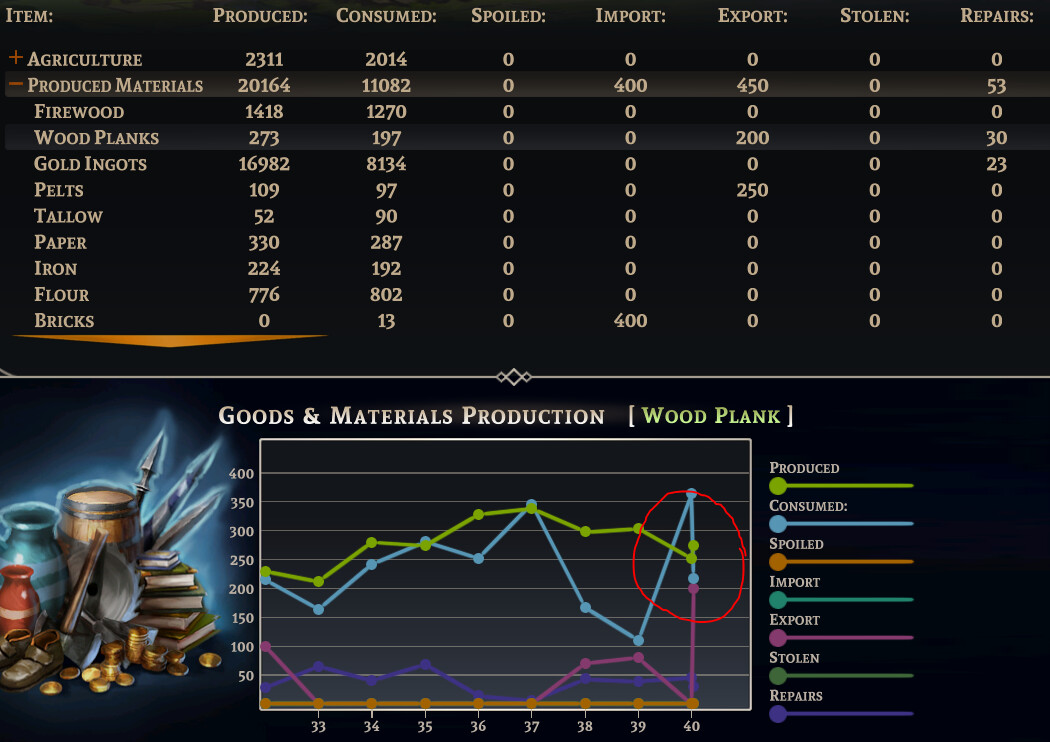
How did I “unconsume” 150 planks in the last 3 days?
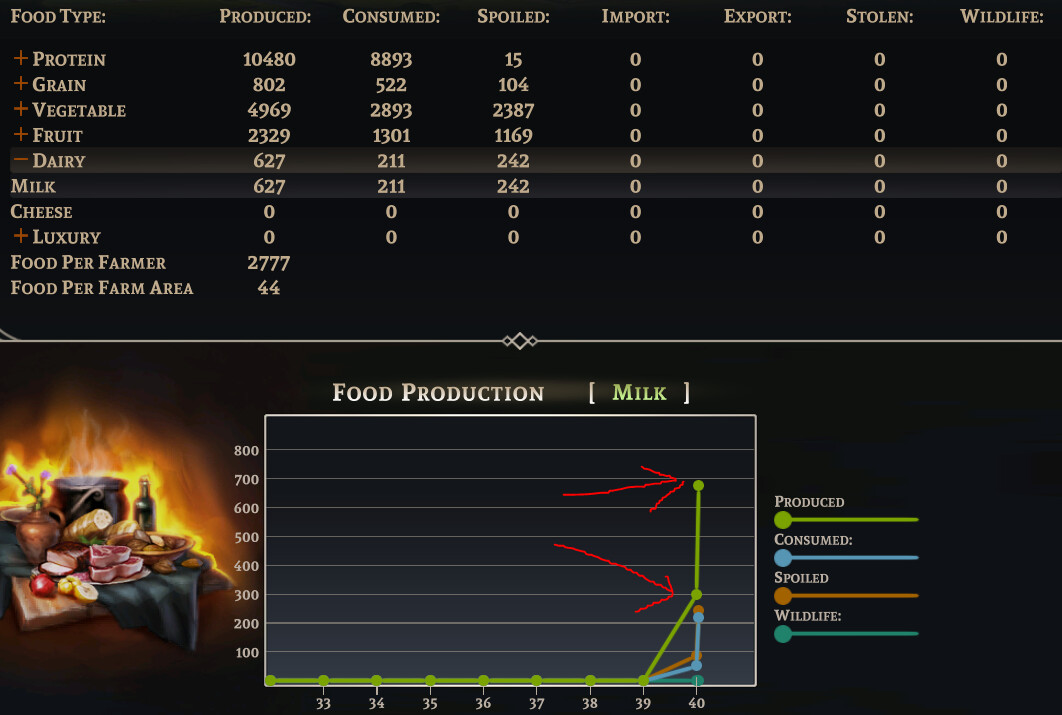
All that in 3 days? Poor cows. Someone call animal protection services.
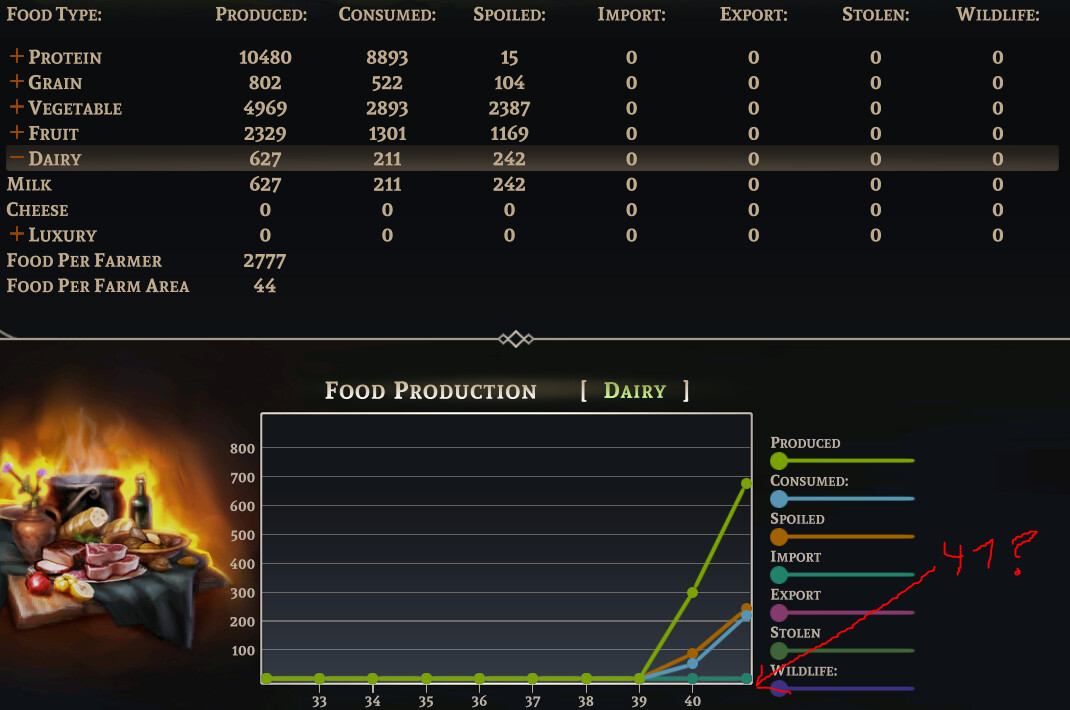
Curiously if I just mouse-over the “Dairy” category, it seem to think we’re already at the end of year 41? I have zero cheese so it should show the same thing as Milk.
Edit: nevermind. This graph is actually correct. I’m almost about to start year 41. No idea why the Milk graph is bugged then. So what seems to be happening is that the graphs are “flattening” the values of the entire year over the start of the year, which coincides with the value from the end of the previous year.
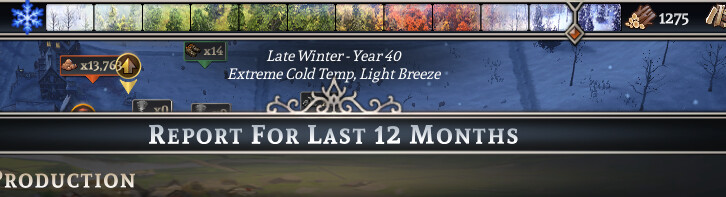
I’m at the start of month 12 of year 40 btw. I can provide a savegame if necessary.
Anyway just trying to help. I’m loving the game!
Thank you Crate for making Farthest Frontier another wonderful gaming gem. ![]()